Following the White Rabbit
When logic and proportion have fallen sloppy dead
And the white knight is talking backwards
And the red queen's off with her head
Remember what the dormouse said
Feed your head, feed your head
-- Jefferson Airplane, White Rabbit
So, this was intended as a quick and smooth addendum to the "50 ways to fill your vector" post, bringing callgrind into the game and ensuring everyone that its instructions counts are a good proxy for walltime performance of your code. This started out as mostly as expected, when measuring the instructions counts in two scenarios:
| implementation/cflags | -O2 not inlined |
-O3 inlined |
| A1 | 2610061438 | 2510061428 |
| A2 | 2610000025 | 2510000015 |
| A3 | 2610000025 | 2510000015 |
| B1 | 3150000009 | 2440000009 |
| B2 | 3150000009 | 2440000009 |
| B3 | 3150000009 | 2440000009 |
| C1 | 3150000009 | 2440000009 |
| C3 | 3300000009 | 2440000009 |
- The A implementations are faster than the B and C implementations on
-O2without inlining - The A implementations are slower (by a smaller amount) than the B and C implementations on
-O3with inlining
- Inline A1-3 compile to the same output on
-Os,-O2,-O3each. There is no difference between-O2and-O3for these. - Inline B1-3 compile to the same output on
-Os,-O2,-O3each, but they differ between optimization levels. - Inline C3 output differs from the others and between optimization levels.
- Without inlinable constructors, the picture is the same, except that A3 and B3 now differ slightly from their kin as expected.
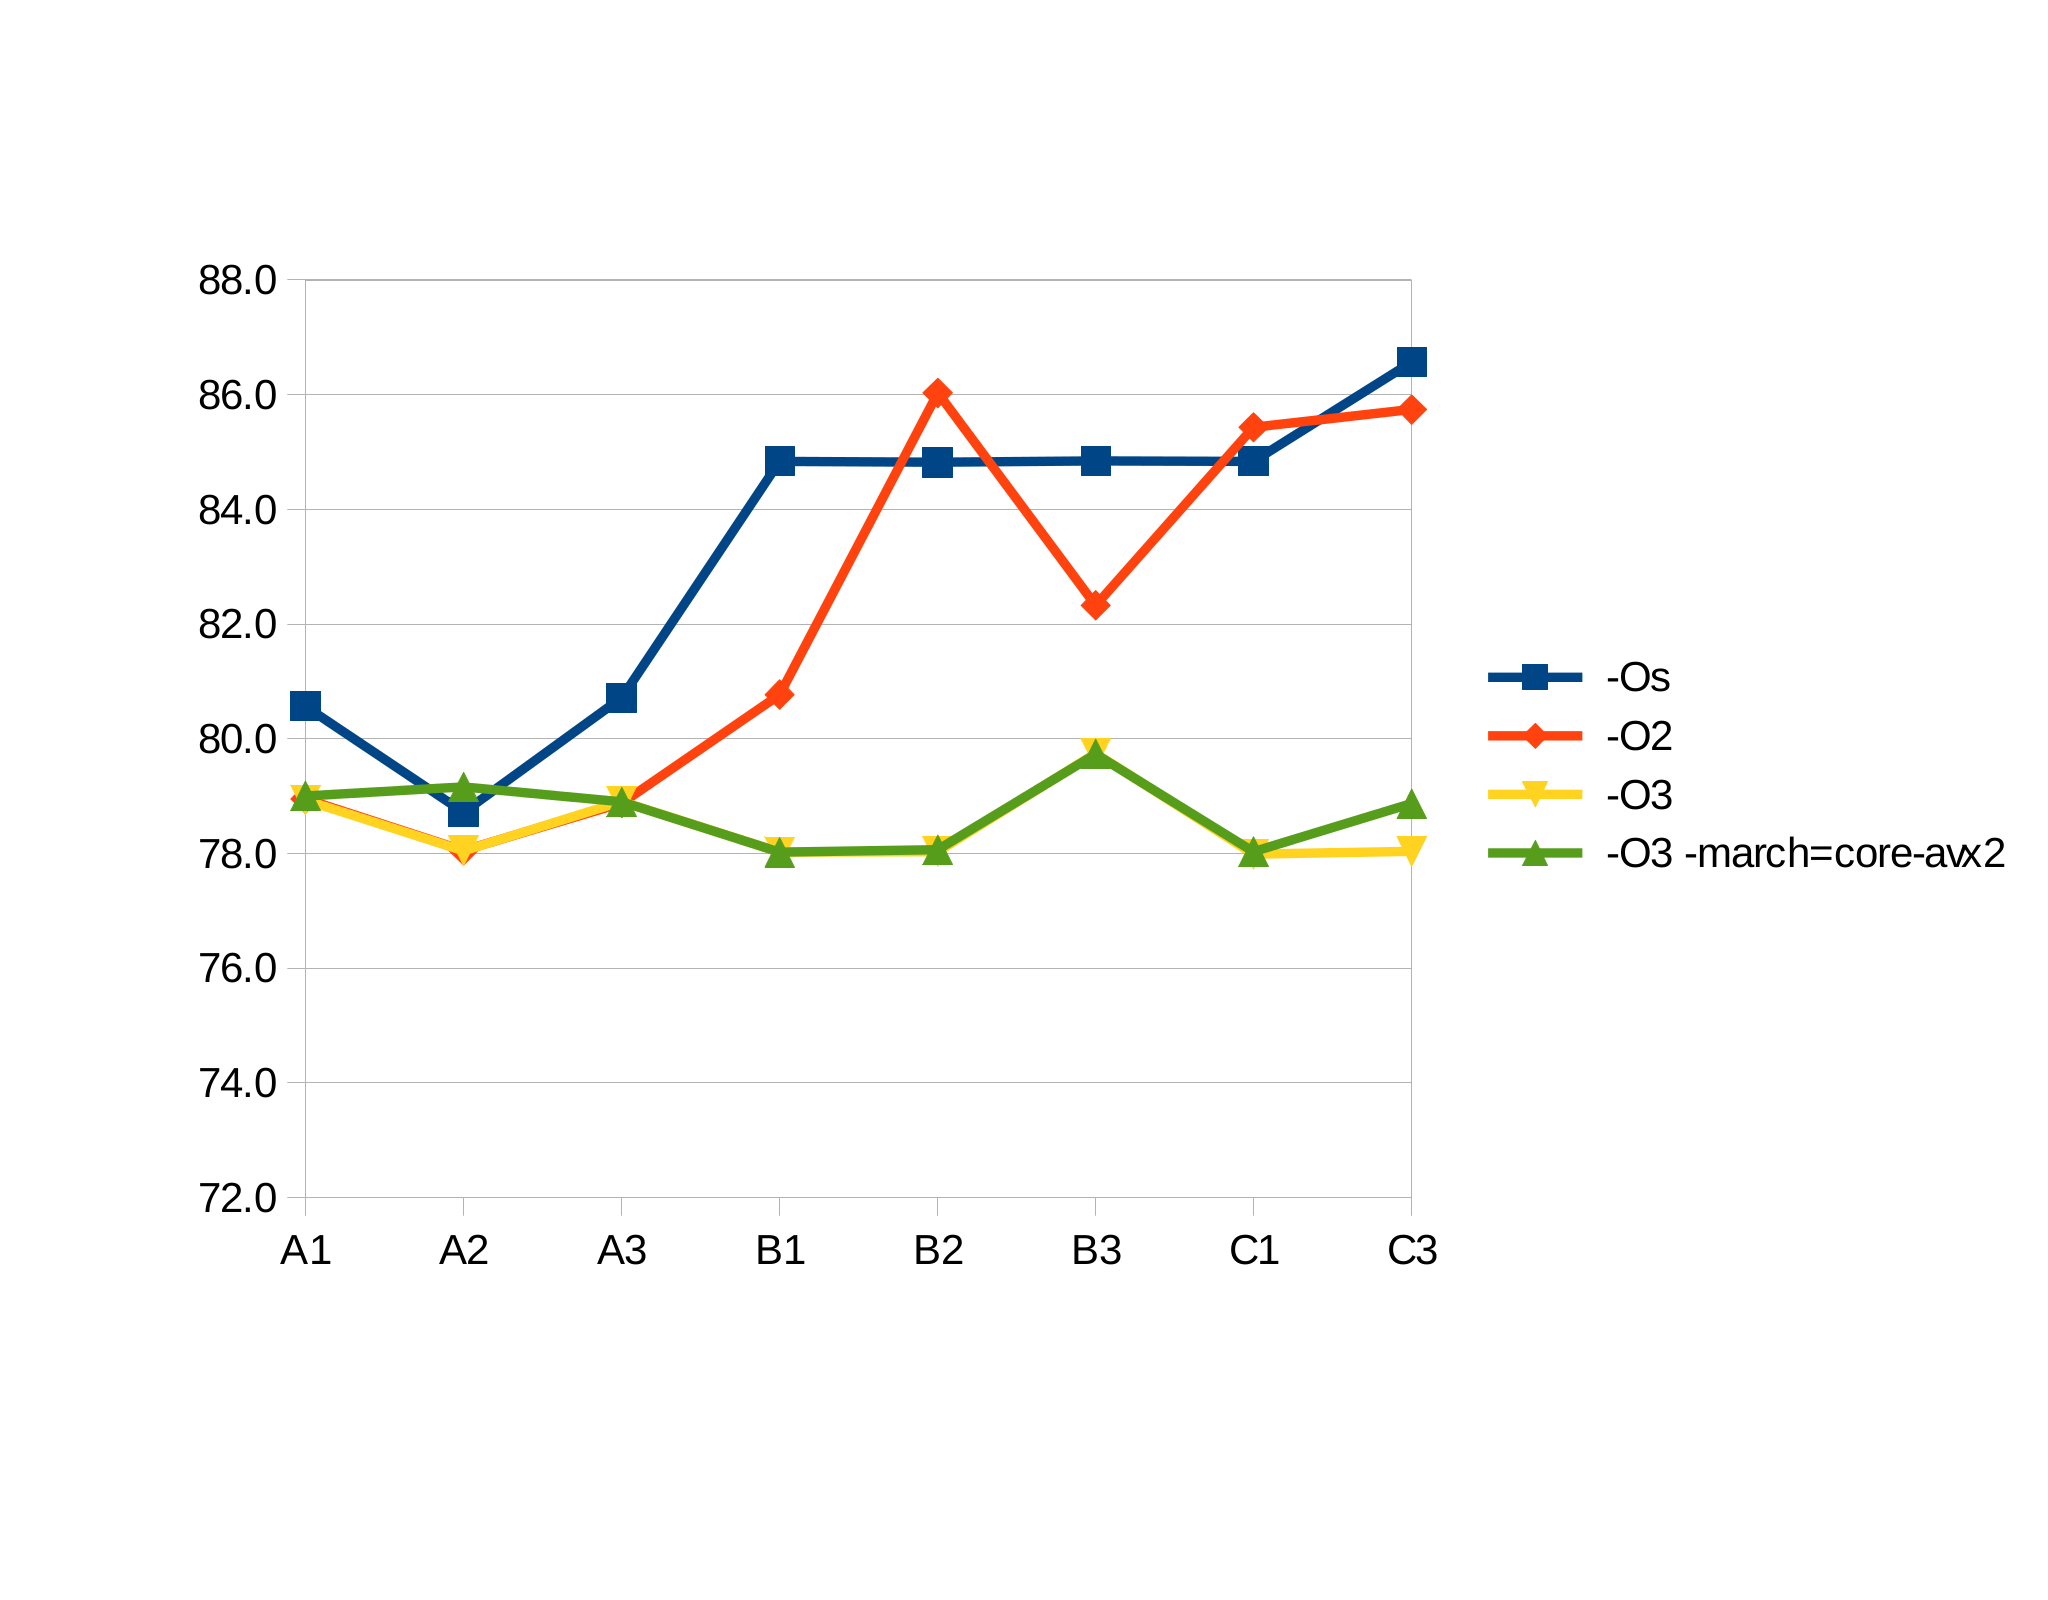
-O2 created widely different walltimes. So time to test the assumption that running one implementation for a minute is producing reasonable statistically stable result, by doing 10 1-minute runs for each implementation and see what the standard deviation is. The following is found for walltimes (no inline constructors):
| implementation/cflags | -Os |
-O2 |
-O3 |
-O3 -march= |
| A1 | 80.6 s | 78.9 s | 78.9 s | 79.0 s |
| A2 | 78.7 s | 78.1 s | 78.0 s | 79.2 s |
| A3 | 80.7 s | 78.9 s | 78.9 s | 78.9 s |
| B1 | 84.8 s | 80.8 s | 78.0 s | 78.0 s |
| B2 | 84.8 s | 86.0 s | 78.0 s | 78.1 s |
| B3 | 84.8 s | 82.3 s | 79.7 s | 79.7 s |
| C1 | 84.4 s | 85.4 s | 78.0 s | 78.0 s |
| C3 | 86.6 s | 85.7 s | 78.0 s | 78.9 s |
And with inlining:
| implementation/cflags | -Os |
-O2 |
-O3 |
-O3 -march= |
| A1 | 76.4 s | 74.5 s | 74.7 s | 73.8 s |
| A2 | 75.4 s | 73.7 s | 73.8 s | 74.5 s |
| A3 | 76.3 s | 74.6 s | 75.5 s | 73.7 s |
| B1 | 80.6 s | 77.1 s | 72.7 s | 73.7 s |
| B2 | 81.4 s | 78.9 s | 72.0 s | 72.0 s |
| B3 | 80.6 s | 78.9 s | 72.8 s | 73.7 s |
| C1 | 81.4 s | 78.9 s | 72.0 s | 72.0 s |
| C3 | 79.7 s | 80.5 s | 72.9 s | 77.8 s |
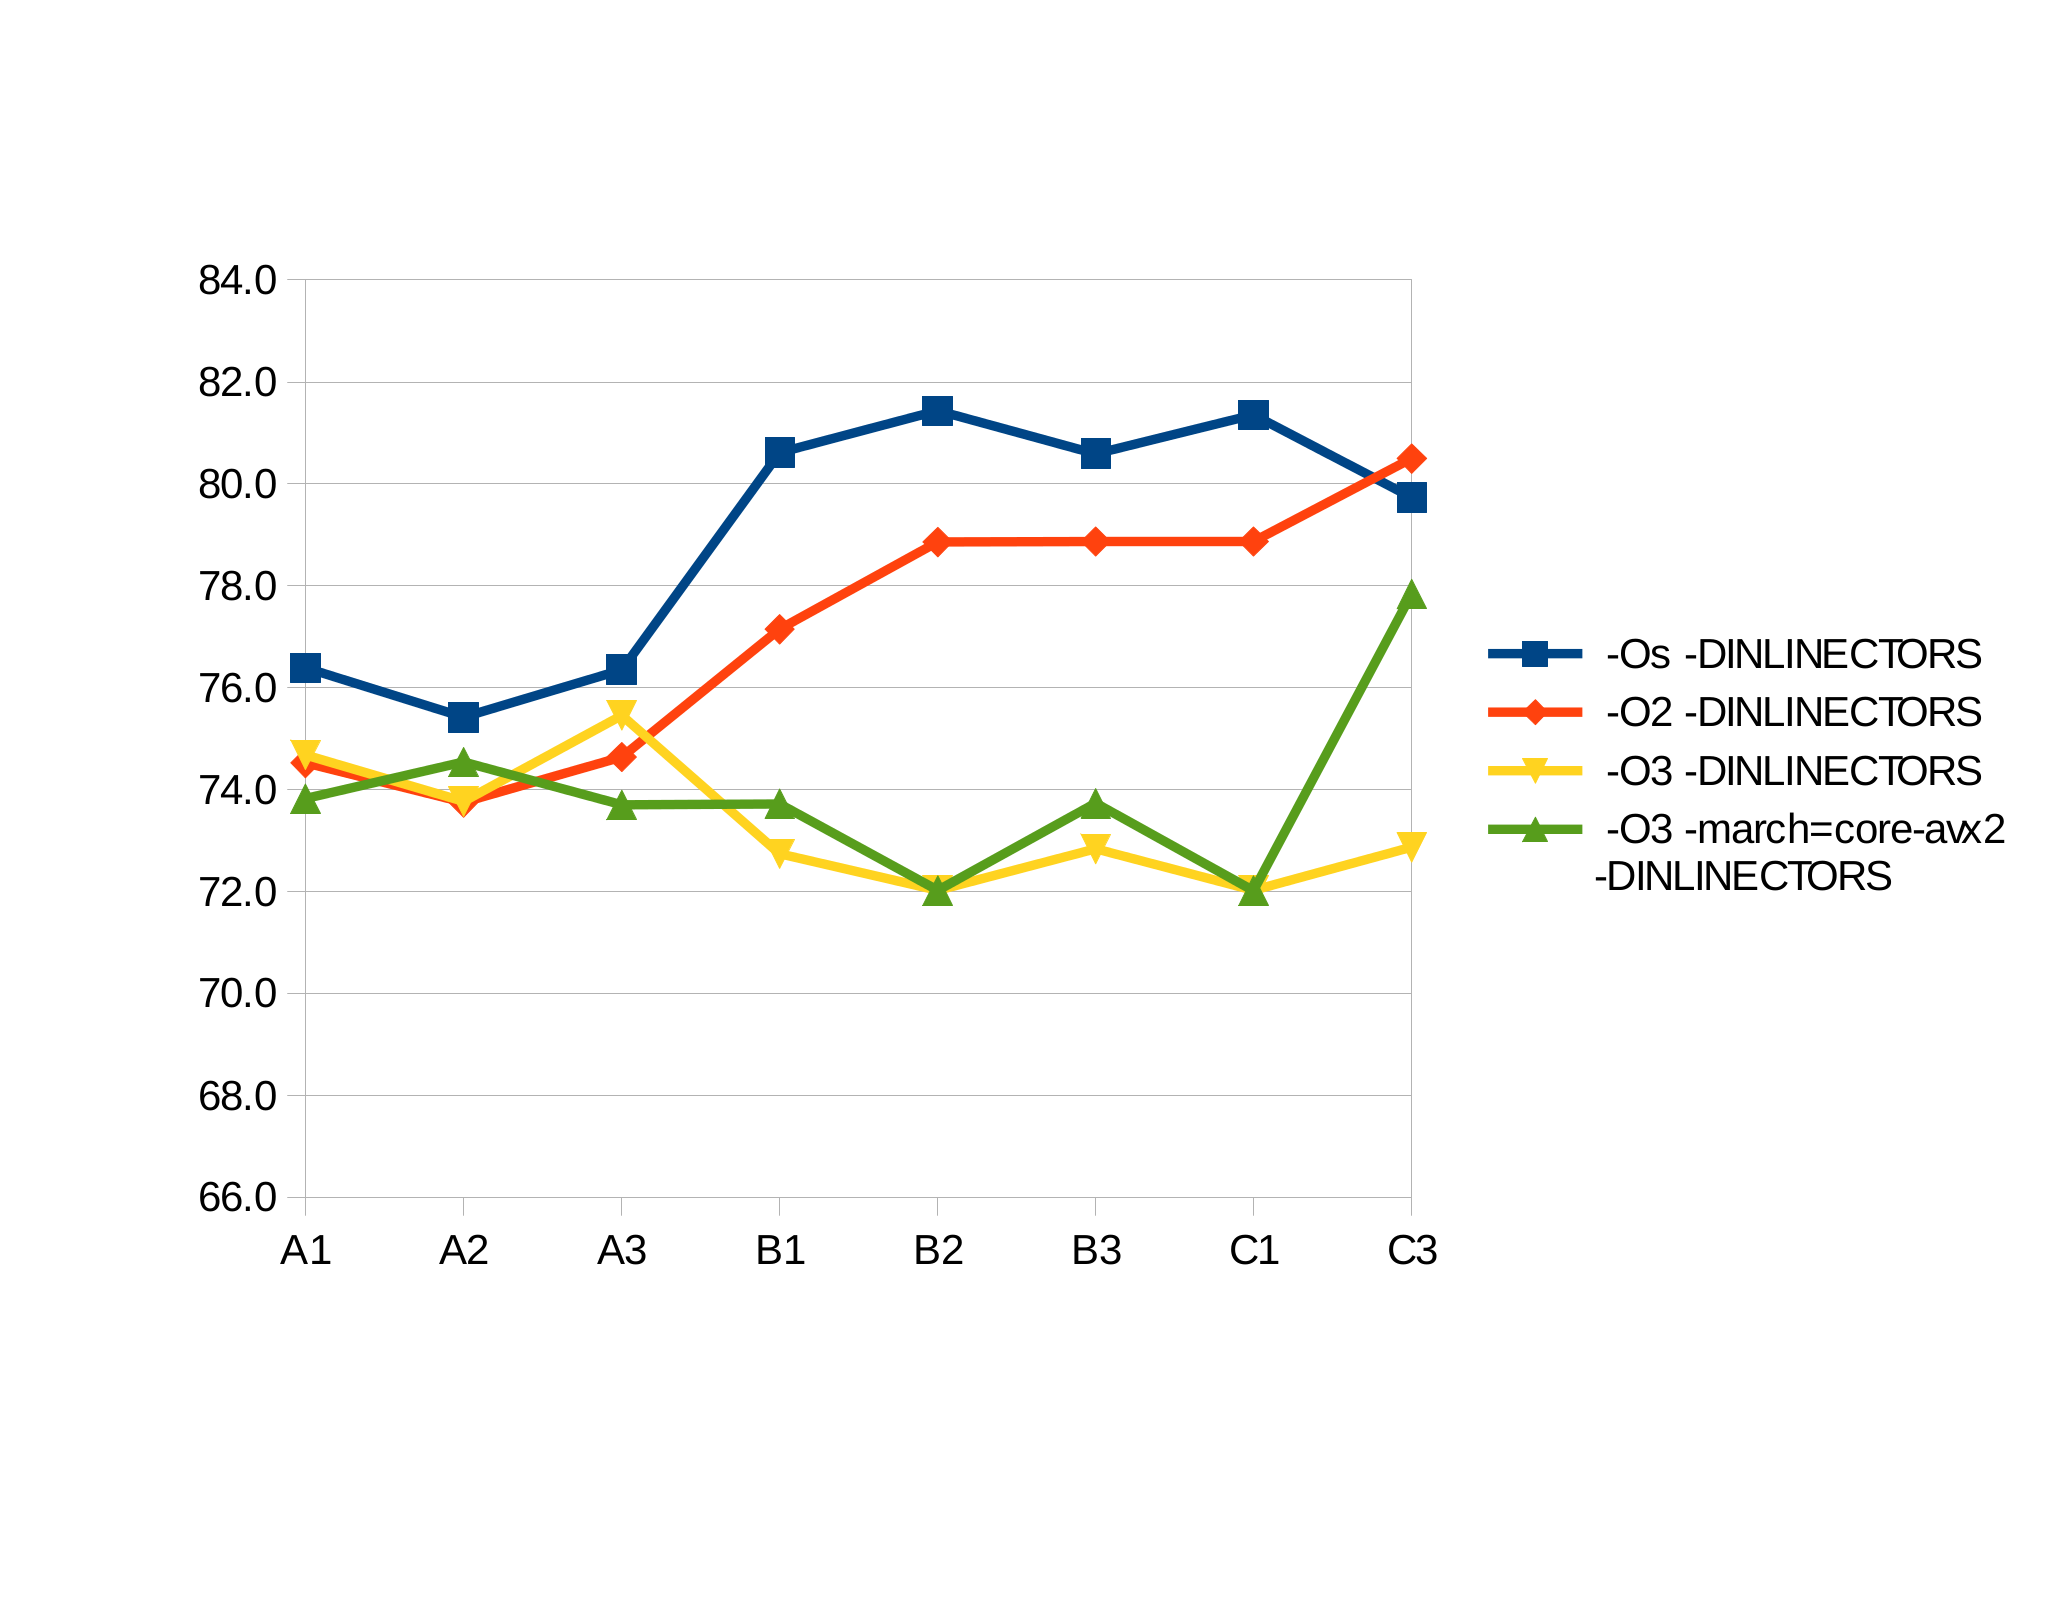
The standard deviation for all the above values is less than 0.2 seconds. That is ... interesting: For example, on -O2 without inlining, B1 and B2 generate the same assembler output, but execute with a very significant difference in hardware (5.2 s difference, or more than 25 standard deviations). So how have logic and proportion fallen sloppy dead here? If the same code is executed -- admittedly from two different locations in the binary -- how can that create such a significant difference in walltime performance, while not being visible at all on callgrind? A wild guess, which I have not confirmed yet, is cache locality: When not inlining constructors, those might be in CPU cache from one copy of the code in the binary, but not for the other. And by the way, it might also hint at the reasons for the -march= flag (which creates bigger code) seeming so uneffective. And it might explain, why performance is rather consistent when using inline constructors. If so, the impact of this is certainly interesting. It also suggest that allowing inlining of hotspots, like recently done with the low-level sw::Ring class, produces much more performance improvement on real hardware than the meager results measured with callgrind. And it reinforces the warning made in that post about not falling in the trap of mistaking the map for the territory: callgrind is not a "map in the scale of a mile to the mile".
Addendum: As said in the previous post, I am still interested in such measurements on other hardware or compilers. All measurements above done with gcc 4.8.3 on Intel i5-4200U@1.6GHz.
Originally published on 2015-03-12 10:44:58 on wordpress.